Dashboard tour
A walk through every part of the dashboard: the top bar, the depth chart, trade cards, the scanner, the Activity log, the Live learning page and the Settings drawer. Labels are quoted exactly as the dashboard shows them.
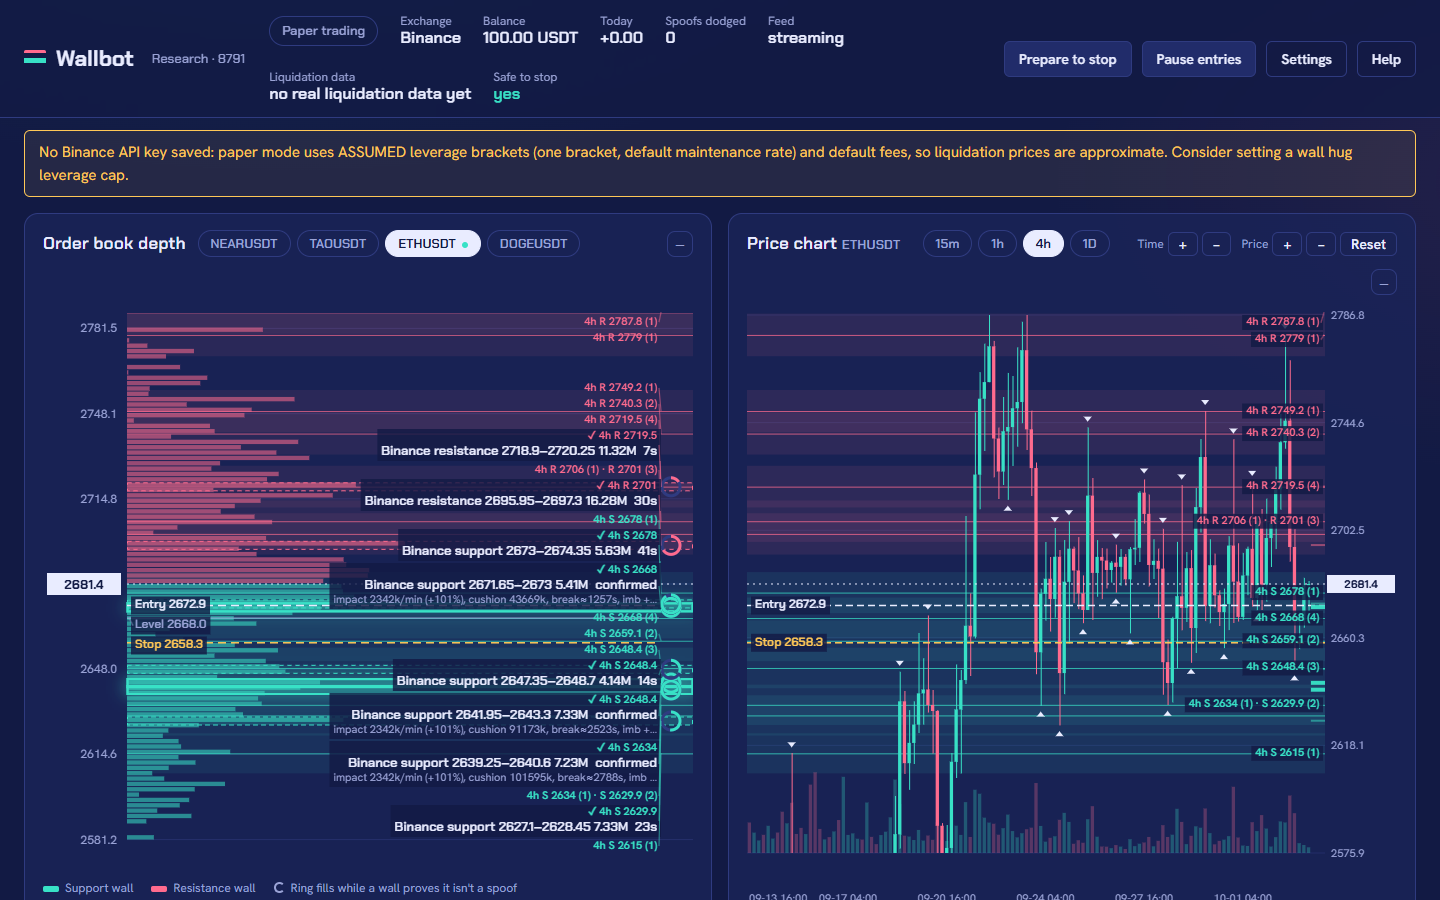
Layout
On a wide screen the dashboard has three rows: the order-book depth chart and the price chart side by side; then the Scanner, Trades (open) and Closed; then the Activity log and, where it appears, Live learning. On a phone the panels are stacked in this order: Trades, depth chart, price chart, Closed, Scanner, Activity, Live learning, under a compact top bar that scrolls away. Both charts are the same height and grow with the window; the panels in the second row are only as tall as their content. On a phone and a tablet the buttons, tabs and tick boxes are large enough to tap, and the page never scrolls sideways.
- One price axis for both charts (
chart_sync_price_axis, on): the depth chart and the price chart show the same price range, and side by side a wall, a 4h level and a candle at the same price sit at the same height. Zooming or panning the price on either chart moves both: the "Price" + and − buttons under the price chart zoom it, and dragging up and down with the mouse on either chart pans it (dragging sideways on the price chart changes the time range). "Reset" on the price chart follows the live price again. Untick "Sync price axis" under the price chart to let each chart scale itself. - Scrolling: the mouse wheel and the trackpad always scroll the page, also over the charts; they never zoom. On a touch screen, swiping up and down scrolls the page; only a sideways drag on the price chart pans it, and pinching zooms the page as usual.
- Chart labels never overlap: when labels would collide they are stacked and moved apart, with a short line back to their price; a label too long for the space ends in "…" and you can hover it to read the full text. When there is no room for all of them, the least important (the levels farthest from the price) are left out first; your trade's Entry, Stop and Level labels are on the left with a dark background.
- Collapsing: the small button at the top right of each panel folds it to its title; your browser remembers which panels you folded.
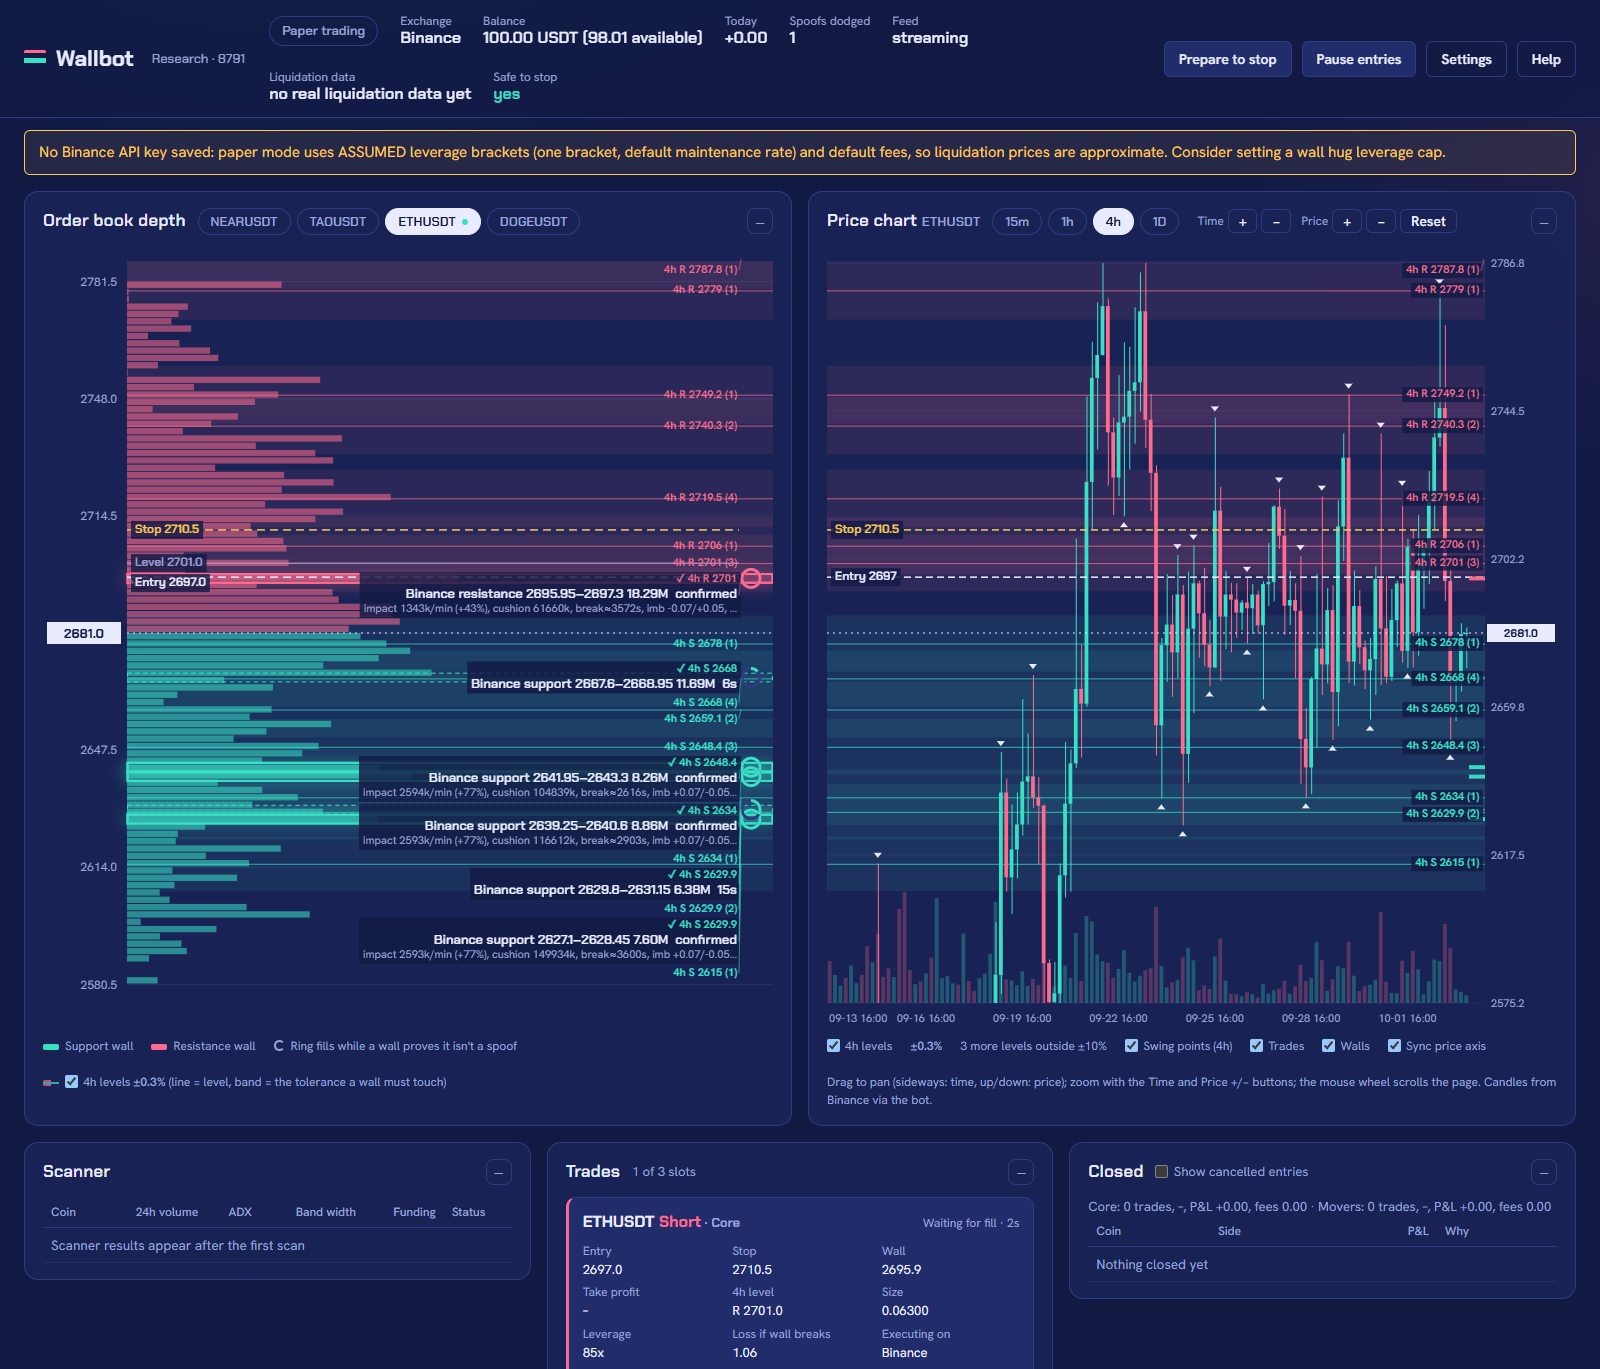
Top bar
The top bar is the bot's status at a glance. Some boxes appear only when they apply.
| Item | What it shows |
|---|---|
| Instance name | Next to the logo, for example "Research · 8787" or "Trading · 8788". |
| Mode pill | "Paper trading", "Testnet trading" or "Live trading". Testnet and live are coloured so you cannot miss them. |
| "Exchange" | Simulator, Binance or MEXC. |
| "Balance" | Total balance in USDT. When part of it is in use, the available amount follows in brackets, e.g. "100.00 USDT (92.40 available)". |
| "Today" | Today's realized P&L in USDT (UTC day), green or red. |
| "Spoofs dodged" | Pending entries cancelled today because their wall was pulled. |
| "Feed" | The market-data connection: "streaming" (Binance), "polling" (MEXC), "reconnecting (...)", "idle" or "stopped". |
| "Recording" | Only with recording on: disk used, files, dropped rows and write errors (red when there are errors). |
| "Disk" | Only where a disk-budget folder is set (on a VPS started with wallbot.sh): everything stored under it against the budget, e.g. "6.2 / 20.0 GB (31%) · recordings 4.1 / 15.0 GB", with "· recording PAUSED" when recording has paused. It turns yellow at the warning level and red near full. See disk_guard and disk_budget_gb. |
| "Recorded coins" | Coins traded and coins "recorded only" (never traded). |
| "Binance requests" | Request weight and order counts used against the bot's 70% budget of Binance's limits. |
| "Liquidation data" | Live fills used to learn the liquidation safety offset, or a message such as "no real liquidation data yet". |
| "Safe to stop" | "yes" (green) or "no" (red). Hover for the reason. See Safe to stop. |
| "Clock vs Binance" | Testnet and live: the clock offset in ms. It turns red above 1000 ms. Hover for the last sync time and any resyncs after error -1021. |
Four buttons sit on the right:
- "Prepare to stop": pauses entries, cancels resting entries and leaves open positions with their stops. While it works it reads "Preparing to stop".
- "Pause entries" / "Resume entries": pausing also cancels pending entry orders. The label shows what pressing it will do.
- "Settings": opens the Settings drawer.
- "Help": opens this manual in a new tab. The bot serves it itself (at
/help/docs/), so it works without the preview server.
A banner under the top bar shows anything that needs your attention: "Paused (since ..., by you). Only Resume entries lifts it.", "Preparing to stop. Safe to stop: NO — ...", "New entries waiting: ...", a rejected API key, warnings, and proposals to lower the liquidation safety offset with an "Approve" button.
Order book depth chart
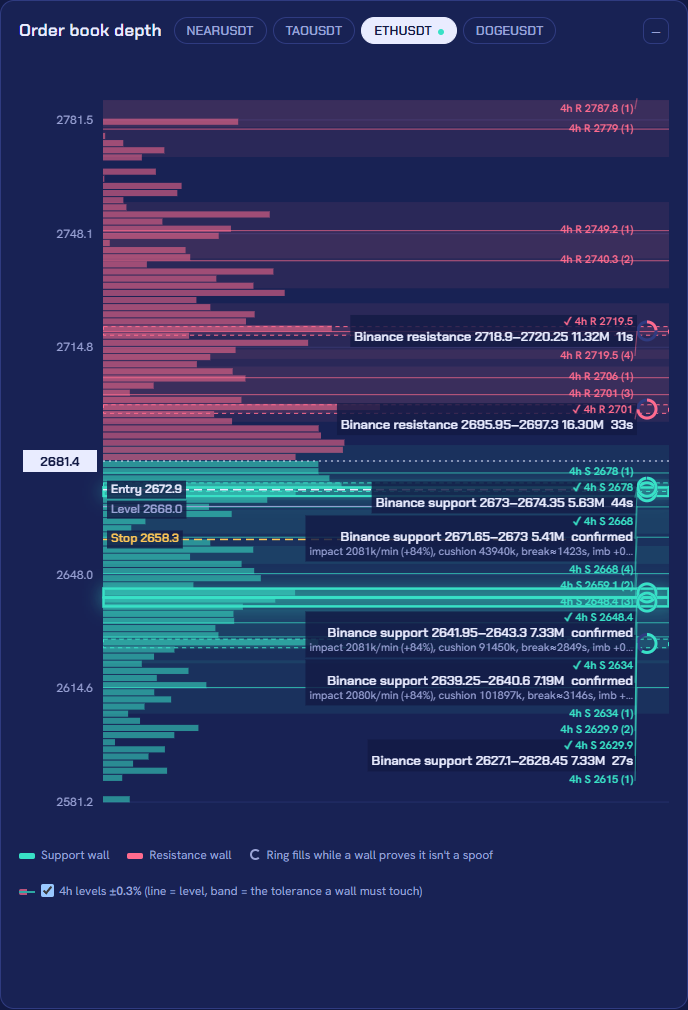
The "Order book depth" panel draws the focused coin's book. Price runs up the left axis, with the current mid price in a box. Bids (support) are teal bars below price; asks (resistance) are coral bars above it.
- Coin tabs at the top choose the coin. A dot marks a coin with a trade.
- Source tabs appear when books come from two exchanges, with the live price gap in bps.
- Walls are shaded bands across the chart. A confirmed wall has a solid, glowing outline; a wall still being checked has a dashed one.
- The ring at the right of each wall fills while the wall proves it is not a spoof (
wall_persist_s).
Each wall label reads like "Binance support 0.5401–0.5404 1.2M confirmed". It gives the source, the side, the exact price range, the size in USDT, and either "confirmed" or the wall's age in seconds. The prices are the exact values the bot uses, never rounded for display (chart_exact_wall_prices). A smaller line underneath may show order-flow measurements; these are for analysis only.
When the focused coin has a trade, dashed lines mark the "Entry" and "Stop" prices, and a thin line marks the support/resistance "Level" the wall was matched to.
Higher-timeframe levels on the chart
Thin horizontal lines with a lightly shaded band mark the support/resistance levels that the level filter uses (sr_filter). They are exactly the levels the bot calculates from 4h swing highs and lows (sr_timeframe, sr_lookback_days, sr_pivot_strength), and the band is the tolerance a wall must touch to pass (sr_tolerance_pct).
- Colour: green for a support level (at or below the current price), red for a resistance level (above it). The role follows the price: a level the price falls through turns from support into resistance. All levels are grey while the level filter is off.
- Labels at the right edge read like "4h S 4.835 (2)": the timeframe, S or R, the level price, and in brackets how many swing points formed it. Labels of levels that would overlap are joined into one line, e.g. "4h S 4.835 (2) · S 4.814 (1)". Only levels inside the visible price range are drawn.
- Wall labels get a small line above them: "✓ 4h S 4.835" when the wall passes the level filter (and which level it matched), or "✗ no 4h level within 0.3%" when it does not. With the filter off it reads "4h level filter off".
- Tolerance: the shaded band around each level is the tolerance a wall must touch, and the same value merges nearby swing points into one level. Next to "4h levels" (under both charts) the coin's current tolerance is shown, e.g. "±0.3%". With
sr_tolerance_mode=atreach coin gets its own value from its volatility, e.g. "±0.08%" on a calm coin; hover it to see the ATR it came from. It changes only when a new 4h candle closes. The "✗ no 4h level within ..." line on a wall uses the same value. - The "4h levels" checkbox under the chart shows or hides them (
chart_show_sr_levels). It is display only and never changes what the bot trades.
The levels are loaded once per newly closed candle for each coin (and when you switch coins), not on every book update. The simulator has no candle history, so it shows no levels.
Price chart and 4h levels
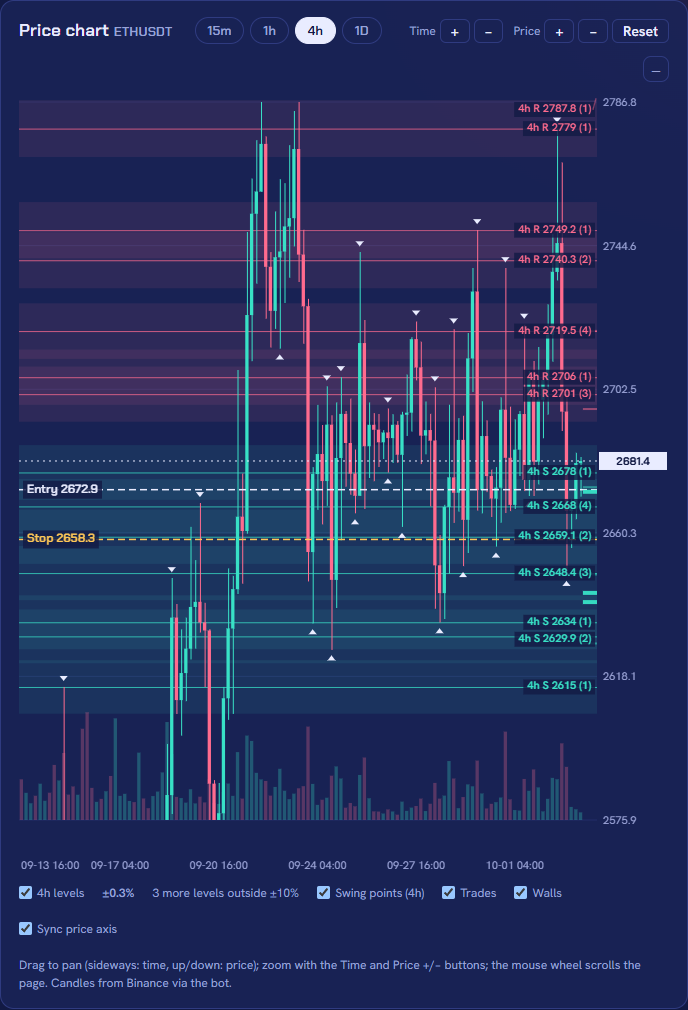
The "Price chart" panel shows candlesticks of the focused coin (the same coin as the depth chart), with volume bars along the bottom of the chart and the current price in a box on the right axis. Use it to check the bot's support/resistance levels against the price history, for example against your own charting app.
- Timeframes: the 15m / 1h / 4h / 1D buttons (4h by default). Zoom with the "Time" + and − buttons (fewer or more candles) and the "Price" + and − buttons (a narrower or wider price range; both charts when the price axis is shared), pan by dragging, and "Reset" goes back to the latest 120 candles and the live price. The mouse wheel scrolls the page. Hovering a candle shows its time, open, high, low, close and volume at the top left.
- 4h levels (
price_chart_levels): exactly the levels the level filter uses, the same as on the depth chart, with the tolerance band and labels like "4h R 5.58 (1)". They are always the level filter's timeframe (sr_timeframe, 4h by default), whichever timeframe the candles use. Green levels are below the current price (support), red ones above it (resistance). - Swing points (
price_chart_swings): on the 4h chart, a small triangle above each candle whose high formed a level and below each candle whose low did. Hover one to see its time, price and the level it belongs to. A level labelled "(2)" was formed by two swing points. - Trades (
price_chart_trades): for an open position, dashed "Entry", "Stop" and "TP" lines; for closed trades, a dot at the entry and a square at the exit joined by a dotted line, green for a win and red for a loss. Hover for the side, the P&L and the close reason. - Walls (
price_chart_walls): short marks at the right edge for the walls the depth chart shows; thick for confirmed walls.
Only the levels within 10% of the current price are drawn (chart_sr_range_pct; 0 draws all), and the legend says how many more there are, e.g. "30 more levels outside ±10%". The bot itself always uses every level.
Each overlay has a checkbox under the chart. The whole panel can be switched off with price_chart. The candles come from Binance through the bot: it fetches each coin and timeframe once, keeps them, and streams only the open chart's current candle (one stream at a time, closed when you switch coin or timeframe, and stopped a minute after no dashboard shows the chart). Your browser only talks to the bot. The simulator has no candle history, so the panel says so there.
Trade cards
The "Trades" panel shows "N of M slots" (M is max_positions) and one card per pending or open trade. Each card shows the coin, Long or Short, the group (Core or Movers), and a state in the top-right corner.
| Card state | Meaning |
|---|---|
| "Waiting for fill · 42s" | Pending: the post-only entry order rests and has not filled yet. |
| "Protected by wall 0.5401–0.5404" | Open, and a confirmed same-side wall starts between the current price and the stop. |
| "Not protected by a wall · stop at breakeven" | Open, no wall between price and stop, and the stop has been moved to breakeven plus fees and slippage. |
| "Not protected by a wall · stop only" | Open, no protecting wall, and the trade is not far enough in profit to move to breakeven. The stop stays where it is. |
| "Trailing stop active" | The trade reached the trailing trigger and the stop now follows the best ROE. |
| "Wall gone, stop active" / "Protected by wall" | Fallback wording when the protection check has no result yet. |
Open trades also show the ROE (profit or loss as a share of margin), "estimated" USDT P&L and the peak ROE, and a bar from loss to profit with a marker where the stop sits. Under the bar, "Stop +50%" shows what the stop locks in; it adds "(trailing)" when the trailing marker is set, even after a restart. The next label shows "Trailing from +100%: ..." with the trailing rule.
The details list shows "Entry", "Stop", "Wall", "Take profit" (with "(armed)" once the exchange order is placed), "TP target wall", "Wall stack", "Re-anchored", "4h level" (the support/resistance level the wall was matched to, e.g. "S 4.835"; named after the level timeframe), "Size", "Leverage", "Loss if wall breaks", "Funding so far", "Executing on", "Wall on" and "Price gap used".
"Funding so far" is the funding paid or received while the position is open, already part of its P&L (include_funding_in_pnl). In paper mode it is simulated from Binance's public funding-rate history and marked "(simulated)".
A red "Close all" button appears when any trade is open. It closes every open position at market and pauses entries. You must type CLOSE ALL to confirm.
Closed trades
The "Closed" panel lists the last 15 trades that actually filled (became a position) and then closed, with "Coin", "Side", "P&L" and "Why": take profit, trailing stop, breakeven stop, stop (wall broke), wall pulled after fill, a manual close, closed while the bot was off and so on. Entries that never filled (the wall was pulled, faded or vanished before the fill, the entry timed out, was re-planned or cancelled) are not listed. A row can end in "· funding +0.0123" when funding was paid or received ("(sim)" in paper), and in testnet and live in "· verified", "· corrected by Binance" or "· not verified": the result of checking the close against Binance's own fills, fees and funding (validate_close_with_binance). Tick "Show cancelled entries" to list them too (closed_show_cancelled). The line above the list gives all-time totals per group (trades, share won, P&L and fees) over filled-and-closed trades only. Nothing is deleted: cancelled entries stay in the database, the Activity log, the reports and the studies.
Start trailing by hand
Each open (filled) position has a "Start trailing" button (manual_trailing_button). It first shows a preview: the current stop, the new stop, the ROE it locks, the trailing mode, and the current and best ROE. Nothing is sent until you confirm. Then trailing starts now from the best ROE so far, as if the trailing trigger had been reached, and continues normally.
- The stop only tightens. If the trailing stop would not be tighter, the current stop stays and trailing still starts.
- It is refused, with nothing changed, if the new stop would trigger at once (for example in a losing trade, where breakeven + fees is beyond the price) or pass liquidation.
- The new stop is placed and confirmed before the old one is cancelled, as with every stop move.
- The card then shows "Trailing stop active (started manually)" and the button "Trailing active" (disabled). Pending entries have no button.
Coins & scanner table
The scanner ranks USDT perpetuals every few minutes and picks the coins to watch. "Next scan in N min" sits in the panel header.
| Column | Meaning |
|---|---|
| "Coin" | The symbol. Watched coins are highlighted. |
| "24h volume" | Quote volume over 24 hours (K, M, B). |
| "ADX" | Trend strength. Lower means a ranging market, where walls tend to hold. |
| "Band width" | Bollinger width percentile. Very low means a squeeze. |
| "Funding" | The current funding rate. |
| "Status" | "Watching", "Watching (mover) · ...", "Eligible", or the reason the coin was left out. |
Common reasons in the Status column:
excluded: on the denylist,excluded: not on the allowlist,excluded: non-ASCII symbol;excluded: listed 12 days ago (minimum 30),excluded: max leverage 10x (minimum 20x);trending (ADX 34),volatility squeeze (8 pctile),funding +0.080%,not enough candles;filtered: ...for coin-suitability and size limits, e.g.filtered: spread 6.2 bps (max 5)orfiltered: smallest position $70.00 > limit $15.
Activity log
The "Activity" panel lists the bot's events, newest first, with the time, the coin ("Bot" for general events) and the message. It keeps the last 250 lines on screen. Lines are coloured by level:
- info: normal events (entries placed, fills, stops moved, scans);
- warn: something to notice (an entry skipped, a pause, a clock resync after -1021);
- critical: something that may need you now (a stop that failed, a position without a confirmed stop). Critical events also send a notification.
The full history is in the log file (logs\wallbot.log or logs\wallbot_live.log). In testnet and live, lines from the paper shadow start with [shadow] in the log file, so they are never mistaken for real orders (shadow_log_tag).
Live learning page
The "Live learning" panel appears on the Trading instance in every mode, and on any instance in testnet or live. Its header gives the mode, the available balance, the balance cap if one applies and the margin per trade.
No screenshot here. The Live learning panel belongs to the Trading instance, and this website never shows screenshots of a real account.
- Buttons: "Run safety check", "Report (markdown)", "Learning log (CSV)", and "Count losses from now" (type
RESET), which restarts the live safety loss count. - "Today (UTC)" and "Reset today's loss count": what counts today toward the live safety daily cap and toward the daily loss limit (
daily_loss_limit_pctof the day's starting balance), the realized P&L today, and the time of a reset. The button starts today's count for both again from zero, so new entries are allowed again today. It never changes the cap values or the total count and never lifts a manual pause; in live mode you typeI ACCEPT. Each reset is recorded in History and notified (daily_loss_reset_button,email_on_loss_reset). - "API key safety checklist": "— all green" or "— NOT ready for live", with one line per item. See the GO LIVE checklist.
- "Entry sizing": how the margin per entry is worked out now ("available + own pending = base"), then a table of the last ten entries: "Time", "Coin", "Available", "Own pending", "Cap", "Base", "Margin", "Free at check".
- "Coins at the current margin": per coin, "Smallest position", "Max leverage", "Largest position" (margin × max leverage) and "Status" ("allowed" or the reason).
- "Since the count started": the loss caps (and "STOPPED: ..." when one is hit), trades, "Funding" (the total, included in P&L), "Binance check" (how many closes were verified, corrected, pending and not verified against Binance), live P&L vs shadow, fills, stop slippage vs the assumed value, liquidation error in ticks, post-only rejections, the longest window without a stop during trailing (must be 0 ms), Binance errors, notifications sent and failed, coins too small to trade, and whether the paper shadow is running.
Settings drawer
"Settings" opens a drawer. At the top, a search box finds any setting by its name, label or description, across all tabs. Below it are the tabs, grouped by purpose (on a phone they become a drop-down). Each tab has a "Save changes" bar that saves the fields shown. In live mode, a change that loosens risk asks you to type I ACCEPT; tightening saves directly. Every change is recorded in History, exactly as before: only the presentation changed.
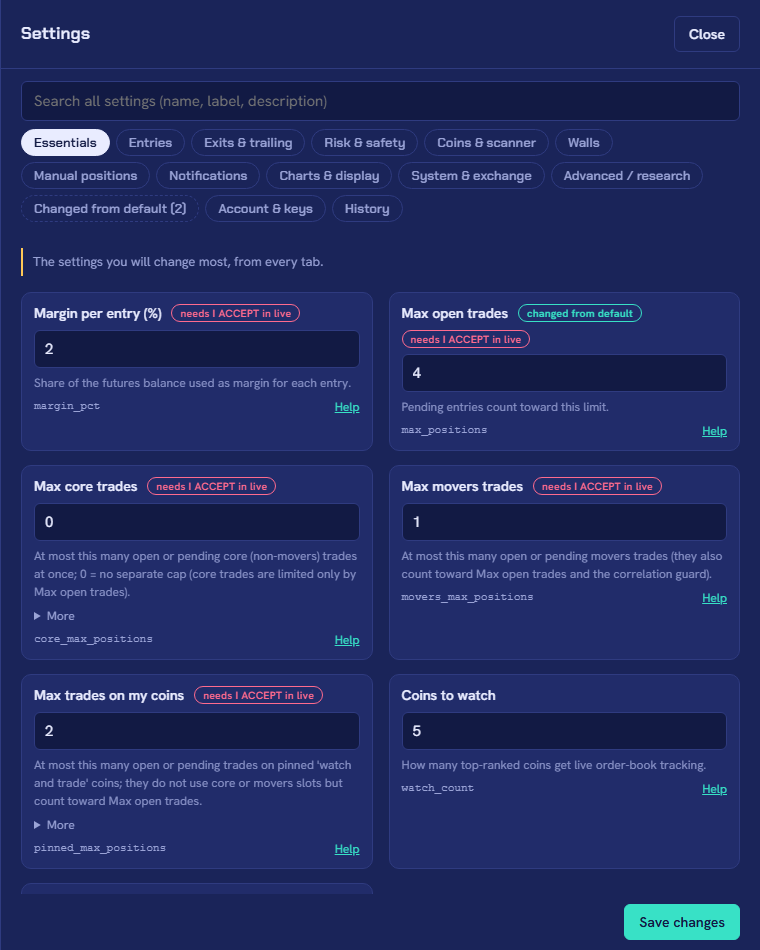
Each setting is a card: its plain-language label, badges, the input, a one-line explanation (More shows the full text), its internal name and a Help link to its entry in this reference. The badges:
- changed from default: the value differs from the default (hover shows the default). The "Changed from default" tab lists all of them.
- needs I ACCEPT in live: in live mode, loosening it asks for the typed confirmation (hover says which direction counts).
- needs restart: read when Wallbot starts (the launcher and log-file settings); restarts the engine: changing it restarts the engine by itself (exchange and book sources); applies at the next start: the paper balance.
A live setting that has a paper-shadow or watch-only variant is shown side by side with it, labelled "Live" and "Paper shadow" (or "Watch (log only)"), for example exit_on_weak_refill and shadow_exit_on_weak_refill.
| Tab | What is there |
|---|---|
| Essentials | The settings you change most, from every tab (each also stays on its own tab). |
| Entries | Entry model and placement, sizing and leverage, re-plans and side switches, the support/resistance level filter, reward/risk. |
| Exits & trailing | Stop placement, breakeven and protection, take profit, trailing (tiers), wall-event exits, the maker exit, the losing-trade exit. |
| Risk & safety | Live loss caps and the balance cap, the daily loss limit, position caps, liquidation buffers, the correlation guard, slippage, the key guard. |
| Coins & scanner | The scanner, core and movers, My coins, coin filters, Never trade and Only trade. |
| Walls | Wall detection and confirmation, spoof detection. |
| Manual positions | Monitoring and alerts for your own positions, Let Wallbot manage, auto-manage and the manual management style. |
| Notifications | Which events send a notification (email and push), the daily summary time, rate limits and alert thresholds. |
| Charts & display | The charts, dashboard refresh, how PnL is shown, the instance name. |
| System & exchange | Exchange and book sources, the paper balance, reconciliation, clock, safe shutdown, the launcher and log files. |
| Advanced / research | Watch-only logs, wall-flow analysis and calibration, market-data recording, the disk budget. |
| Changed from default | Every setting whose value differs from its default, on all tabs. |
| Account & keys | Mode buttons, API key slots, "Email (SMTP)" and "Push notifications (ntfy)". |
| History | The last 50 settings changes: "When", "Setting", "Old", "New", "By" (dashboard, script or system). Secrets are never shown, only that they changed. |
My coins
The "My coins" panel pins coins you want to follow, on top of the scanner's core and movers lists. Type a symbol (the list suggests the exchange's USDⓈ-M symbols), choose "Watch only" or "Watch and trade", and press Add; each row has its mode and a Remove button, and clicking the symbol focuses its charts. Pinned coins appear in the coin tabs under "Pinned", with the depth chart, price chart and wall labels like every other coin.
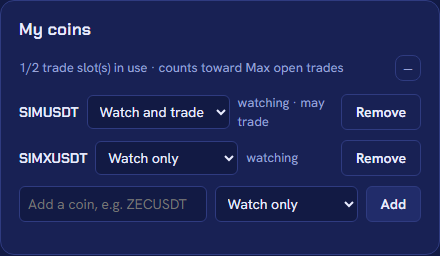
- Watch only coins are never traded. Watch and trade coins pass every normal entry check, in their own slots (
pinned_max_positions, 2), which also count towardmax_positions. - A coin on
symbol_denylistcan only be watched. - The safety checks (listing age, minimum max leverage, spread, tick size, depth, smallest position) always apply before a pinned coin is traded; the ranking filters only when
pinned_skip_scanner_filtersis off. Each row says "may trade" or "trading blocked:" with the reason. - The list is the setting
pinned_coins: every change goes through the normal settings path and appears in History; in live mode, setting a coin to watch and trade asks forI ACCEPT. - Each pinned coin adds one live order-book and trade stream (about 1.3% of a CPU core on the VPS).
History
Two places keep history for you. Trades are in the "Closed" list on the main page and in the daily summary notification. Settings changes, mode switches and key changes are in Settings → History, and each one is also sent as a "settings changes" notification when that switch is on. The settings history is never pruned.